Amazon, being the most popular e-commerce site worldwide, makes it difficult to determine the total number of sellers on the platform. However, according to the latest reports, 9.7 million people sell on Amazon.
Of them, just 19.59% of the sellers actively make sales on the platform. Besides, according to JungleScout’s latest report, most of the sellers on the platform are from the United States.
Let’s explore in detail about the number of Amazon sellers worldwide, their demographics, sales, revenue, profits, and more in this post.
Amazon Seller Statistics 2025: Editor’s Picks
- 9.7 million Amazon sellers are there worldwide as of 2025.
- Just 1.9 million Amazon sellers are active.
- 89% of Amazon sellers are successful.
- Around two-thirds of Amazon sellers become profitable within the first year.
- 55% of Amazon sellers are from the United States.
- California has the highest number of Amazon sellers in the United States, at 18%.
- Third-party sellers sold 61% of the paid units on Amazon as of Q4 2024.
How Many Amazon Sellers Are There?
There are 9.7 million Amazon sellers worldwide.
Of them, just 1.9 million Amazon sellers actively sell their products on the platform.
Source: Seller App, eDesk
How Many Amazon Sellers Are Successful?
89% of Amazon sellers are successful.
64% of Amazon sellers become successful within the first year. Of these, 46% of Amazon sellers have an average success rate between 11% and 25% through Amazon FBA.
Source: Sellers session, eDesk
Amazon Seller By Type
68% of Amazon sellers, brands, and small businesses are 3rd party sellers as of 2025.
Meanwhile, 40% of sellers on Amazon are first-party sellers, and 9% of the sellers prefer both first-party and third-party selling.
Besides, 17% of Amazon sellers also prefer to sell in the brick-and-mortar stores.
Source: Jungle Scout
Amazon Seller Demographics
64% of Amazon sellers are between 25 and 44 years old.
The majority of Amazon sellers are aged 25 to 34 years. Conversely, the lowest share of Amazon sellers are aged 65 to 80 years.
Besides, just 22% of Amazon sellers belong to the age group of 45 to 64 years.
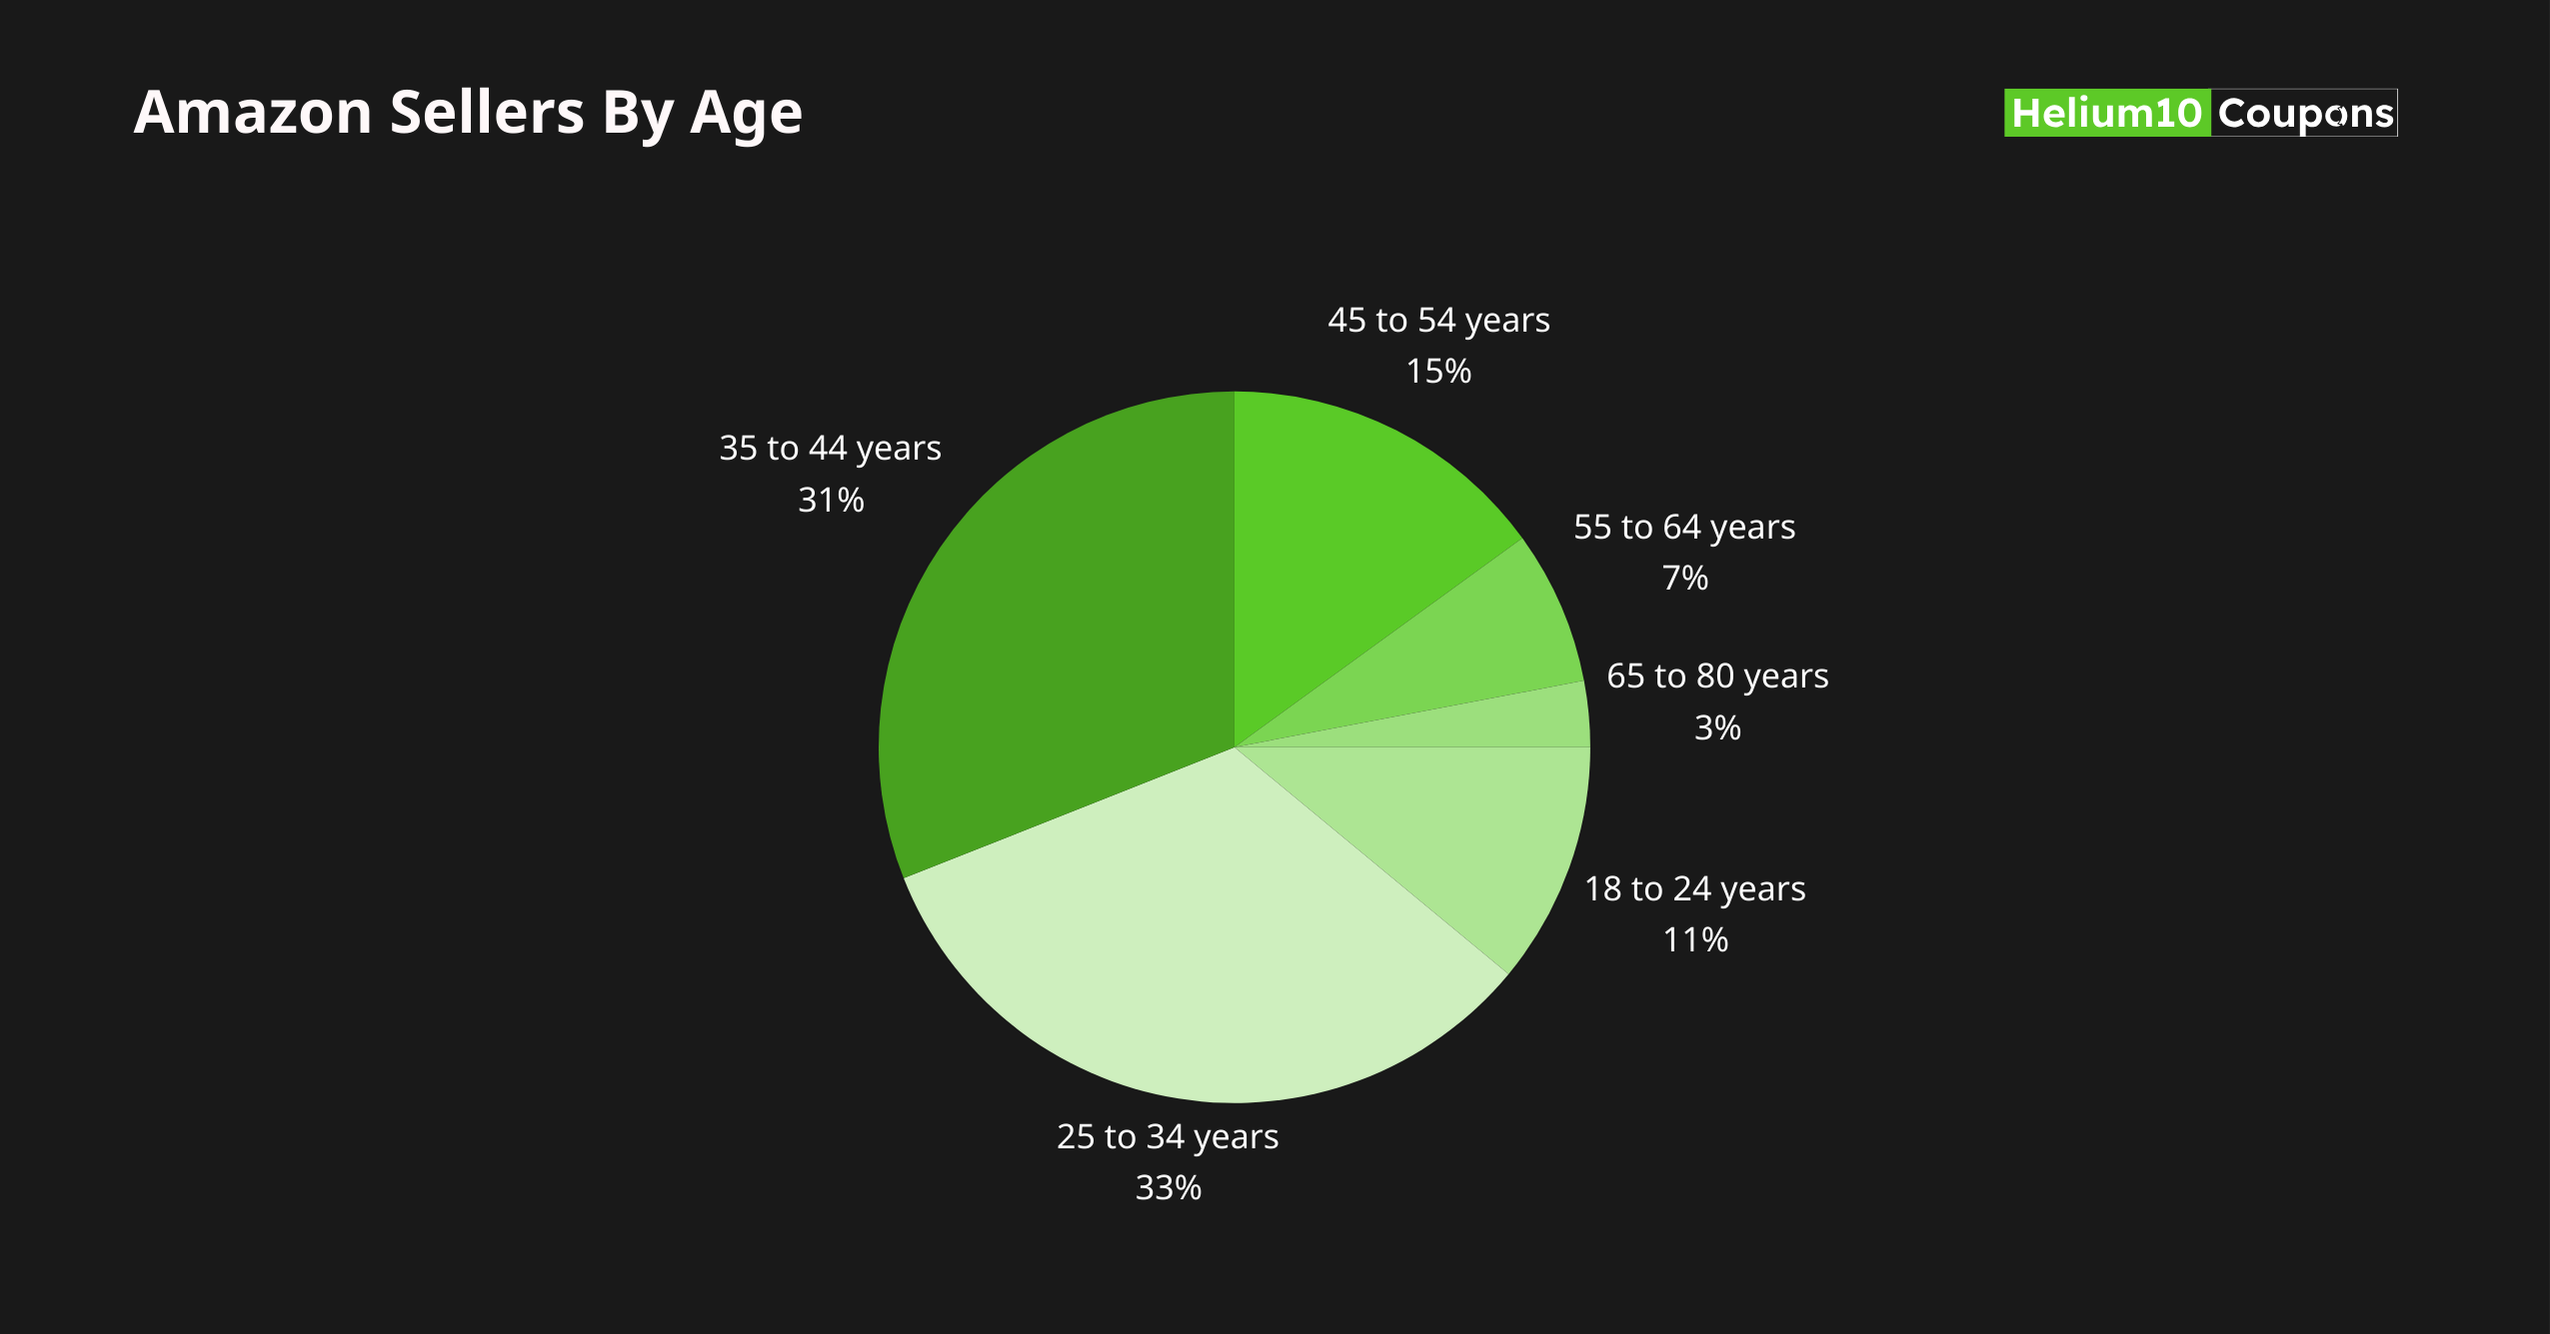
The following table displays the distribution of Amazon sellers by age group as of 2025.
| Age Group | Amazon Sellers |
|---|---|
| 18 to 24 years | 11% |
| 25 to 34 years | 33% |
| 35 to 44 years | 31% |
| 45 to 54 years | 15% |
| 55 to 64 years | 7% |
| 65 to 80 years | 3% |
Source: Jungle Scout
67% of Amazon sellers worldwide are male.
At the same time, 1 in 3 Amazon sellers are female. The number of male Amazon sellers is more than double compared to the number of female Amazon sellers.
The following table displays the share of Amazon Sellers by gender.
| Gender | Share Of Amazon Sellers |
|---|---|
| Male | 67% |
| Female | 30% |
| Other/ Prefer not to Say | 2% |
Note: The values may not be equal to 100% due to rounding.
Source: Jungle Scout
4 in 10 Amazon sellers have a bachelor’s degree.
Meanwhile, 26% of Amazon sellers have a master’s or equivalent degree.
On the other hand, just 2% of Amazon sellers have trade, technical, vocational, or another degree, while just 3% have not completed high school or secondary school.
The following table displays the distribution of Amazon sellers according to their level of education.
| Education level | Percentage of Amazon Sellers |
|---|---|
| Bachelors or equivalent | 40% |
| Masters or equivalent | 26% |
| High School diploma/ GED/ Secondary Education | 14% |
| Associate degree/ some post-secondary education | 11% |
| Doctoral or equivalent | 5% |
| No high school/ GED/ Secondary education | 3% |
| Trade/ technical/ Vocational or other | 2% |
Source: Jungle Scout
37% of Amazon sellers are employed full-time and work over 40 hours a week.
Besides, 22% of Amazon sellers are working exclusively in the e-commerce business, and 14% of the sellers are employed part-time.
Conversely, 3% of Amazon sellers are students, and 19% of the sellers are self-employed.
Further, 61% of the sellers and small businesses own two or more brands, and 52% of the sellers have side hustles or side jobs besides selling online.
The following table provides a distribution of Amazon sellers according to their employment status.
| Share of Amazon Sellers | Percentage of Amazon Sellers |
|---|---|
| Employed Full-time (Working 40+ hours a week) | 37% |
| Work Exclusively on ecommerce businesses | 22% |
| Self-employed/ entrepreneur | 19% |
| Employed part-time | 14% |
| Students | 3% |
| Retired | 2% |
| Not Employed/ looking for work | 1% |
| Not currently employed | 1% |
| Disabled, not able to work | 1% |
Source: Jungle Scout
Amazon Seller By Country
55% of Amazon sellers are from the United States.
The United States accounts for the highest number of Amazon sellers worldwide.
The United Kingdom has the second-highest share of Amazon sellers, but only 7% of Amazon sellers are in the country.
Other countries with a significant share of Amazon sellers are Canada, India, and United States territories.
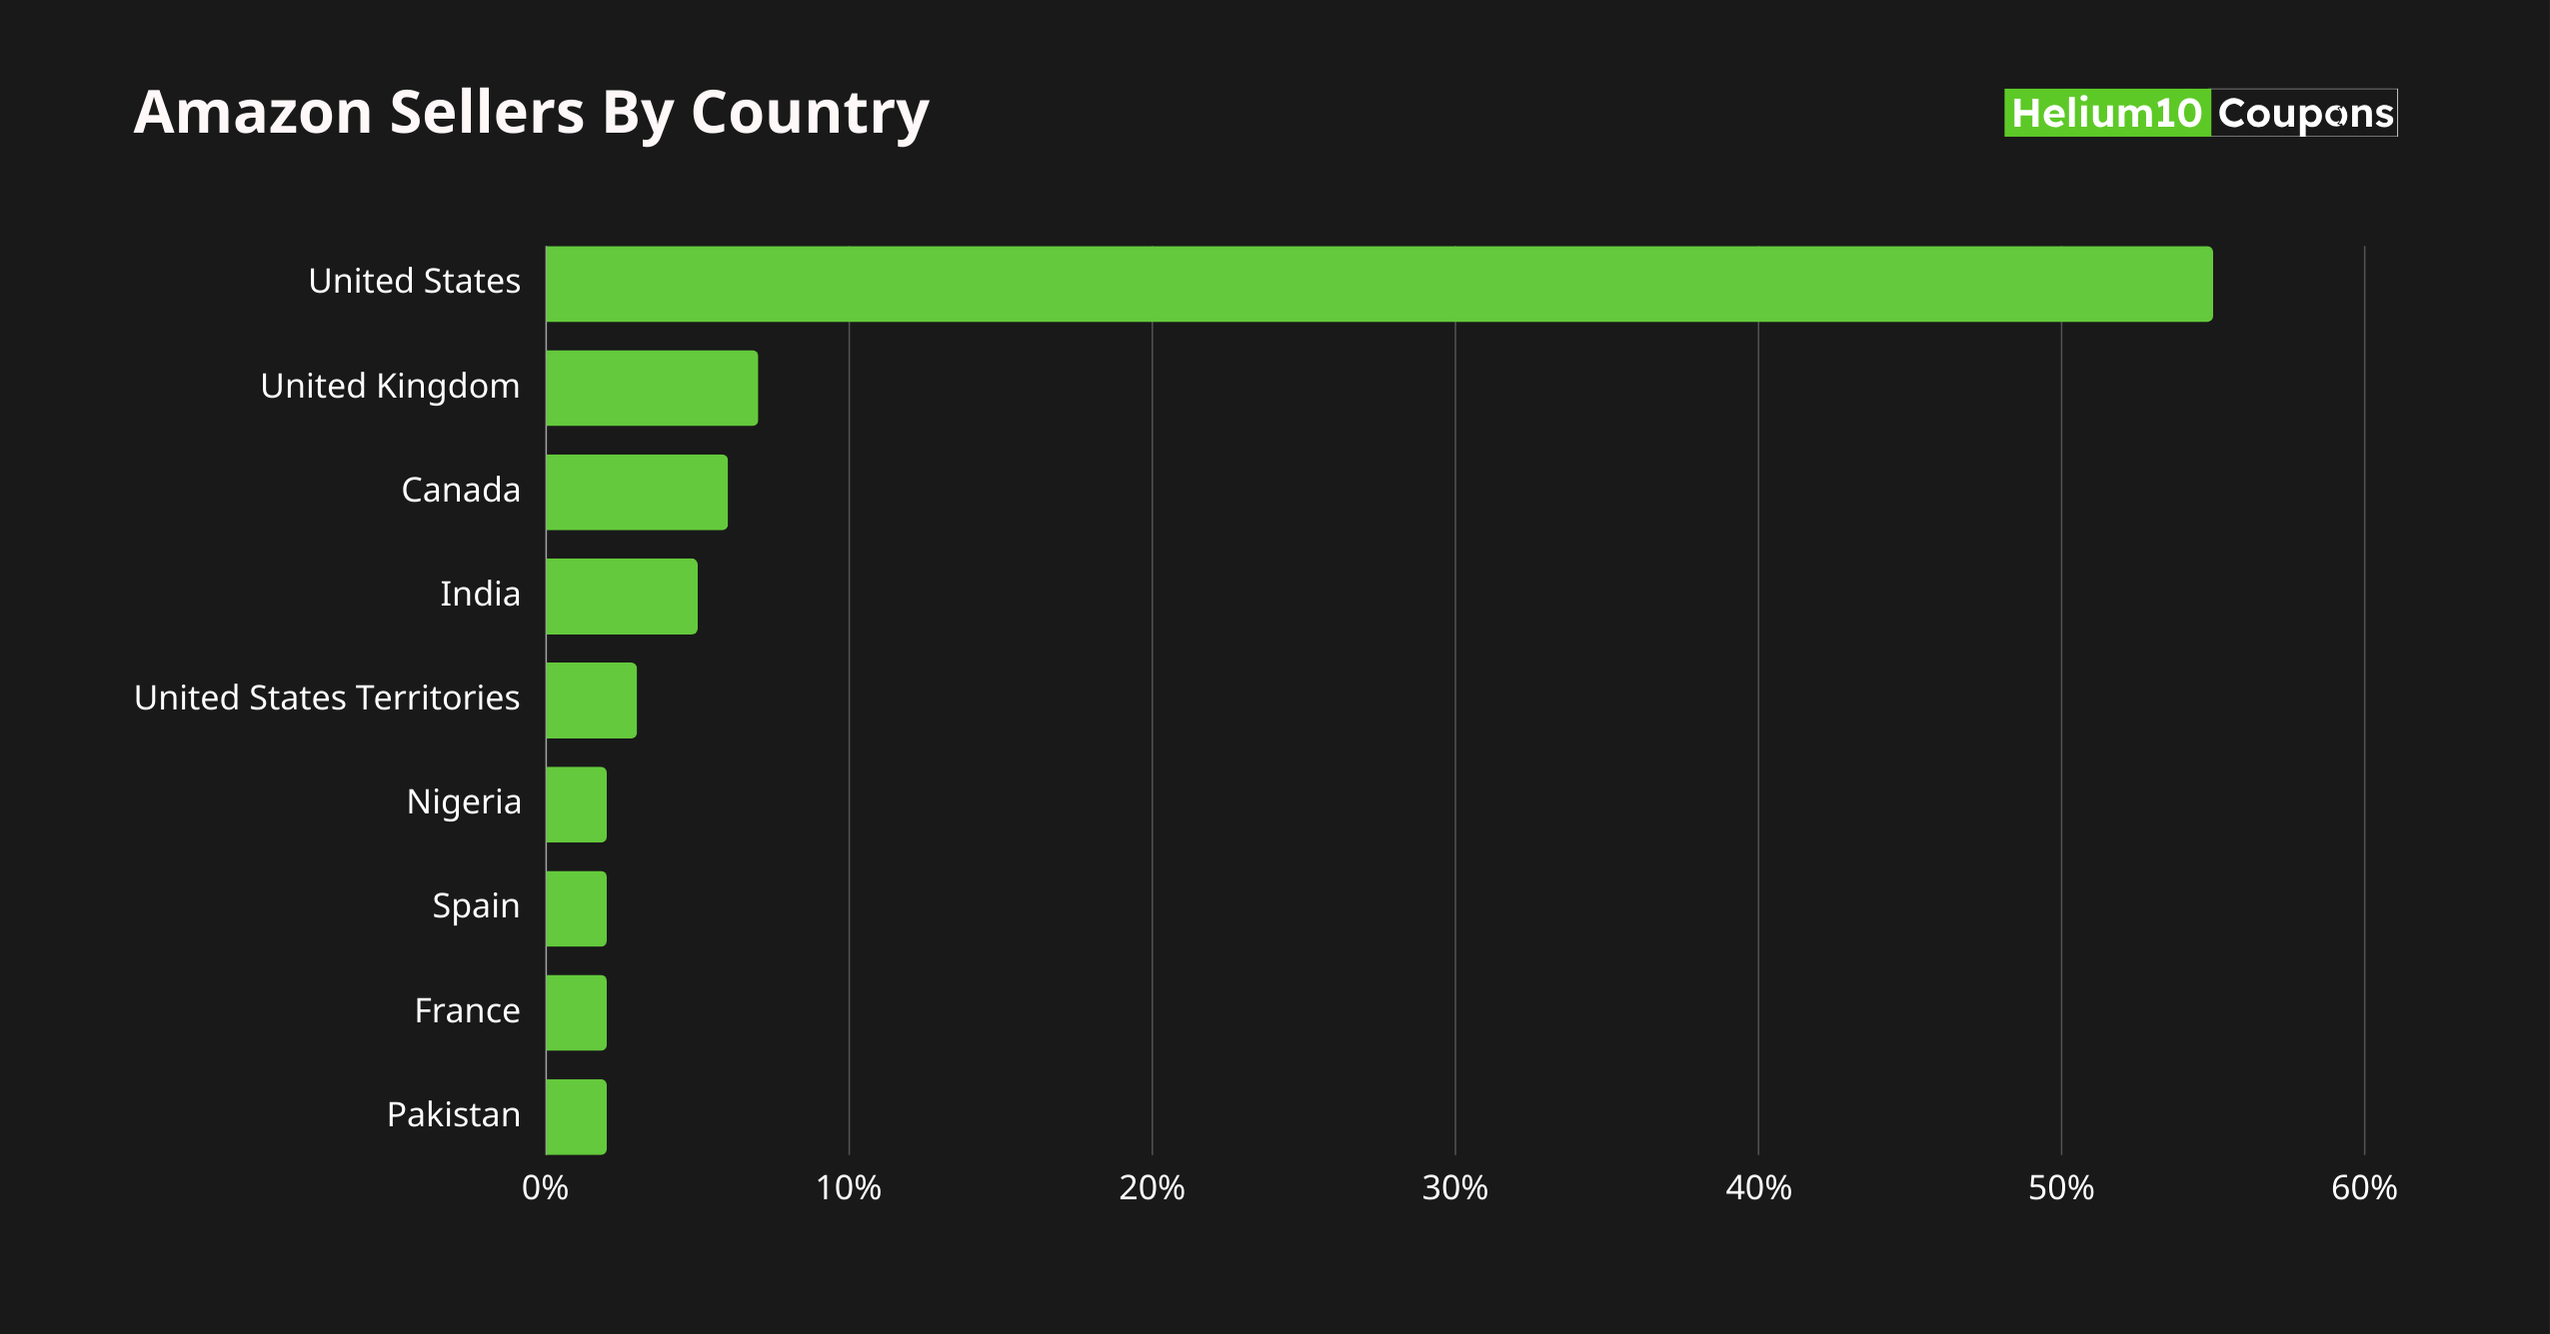
The following table displays the share of Amazon sellers by country.
| Country | Percentage of Amazon Sellers |
|---|---|
| United States | 55% |
| United Kingdom | 7% |
| Canada | 6% |
| India | 5% |
| United States Territories | 3% |
| Nigeria | 2% |
| Spain | 2% |
| France | 2% |
| Pakistan | 2% |
Source: Jungle Scout
Amazon Seller By States
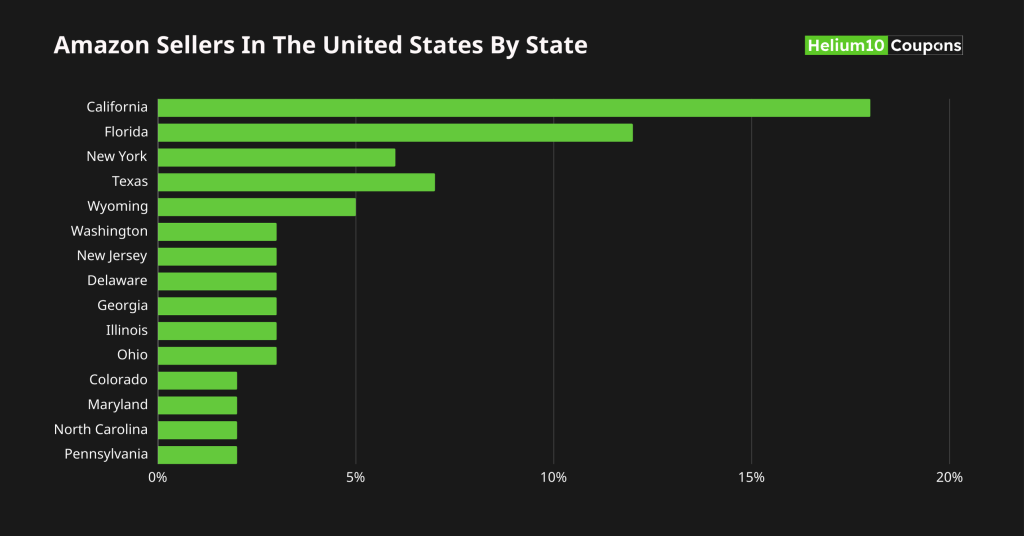
California has the highest number of Amazon sellers in the United States, with 18% of the sellers living there.
Besides, Florida is home to 12% of Amazon sellers, and New York is home to 6% of Amazon sellers.
Besides, other states with a significant share of Amazon sellers are Texas, Wyoming, New Jersey, etc.
The following table displays the distribution of Amazon sellers in the United States by State.
| State | Percentage of Amazon Sellers |
|---|---|
| California | 18% |
| Florida | 12% |
| New York | 6% |
| Texas | 7% |
| Wyoming | 5% |
| Washington | 3% |
| New Jersey | 3% |
| Delaware | 3% |
| Georgia | 3% |
| Illinois | 3% |
| Ohio | 3% |
| Colorado | 2% |
| Maryland | 2% |
| North Carolina | 2% |
| Pennsylvania | 2% |
Source: Jungle Scout
Amazon Seller Revenue Statistics
70% of Amazon sellers and small businesses generate a sales revenue of $5000 or less every month.
Conversely, just 3 in 10 Amazon sellers make a sale revenue of over $5000 per month.
Further, 4% of Amazon sellers and small businesses are able to generate a sales revenue of $50,001 to $100,000.
Here is a table displaying the share of Amazon sellers and small businesses according to monthly sales revenue generated.
| Monthly Sales Revenue | Percentage of Amazon Sellers and SMBs |
|---|---|
| Under $500 | 31% |
| $501 to $1,000 | 17% |
| $1,001 to $5,000 | 22% |
| $5,001 to $10,000 | 11% |
| $10,001 to $25,000 | 7% |
| $25,001 to $50,000 | 5% |
| $50,001 to $100,000 | 4% |
| $100,001 to 250,000 | 1% |
| $251,000 to $500,000 | 1% |
| $500,000 to $1,000,000 | 1% |
Source: Jungle Scout
57% of Amazon sellers have generated a total sales revenue of $50,000 or less.
On the other side, just 1% of Amazon sellers could generate a sales revenue of more than $5 million in their lifetime.
Further, 5% of Amazon sellers generated a sales revenue between $1 million and $5 million during their lifetime.
The following table displays the distribution of the sales revenue generated by Amazon sellers in their lifetime.
| Lifetime Sales Revenue | Percentage of Amazon Sellers and SMBs |
|---|---|
| Under $25,000 | 47% |
| $25,000 to $50,000 | 10% |
| $50,001 to $100,000 | 6% |
| $100,001 to $500,000 | 10% |
| $500,001 to $1 million | 8% |
| $1 million to $5 million | 5% |
| More than $5 million | 1% |
| Don’t know | 13% |
Source: Jungle Scout
Amazon Seller Sales Statistics
On average, 61% of the paid units on Amazon were sold by third-party sellers as of Q4 2024.
Comparatively, 60% of sales on Amazon were generated by third-party sellers on the platform in 2023.
However, in Q4 2023, the share of the sales made by the third-party sellers on the platform was 61%, the same as in Q4 of 2024.
The sales generated on Amazon by third-party sellers increased from 50% in 2017 to 61% in 2025, displaying a growth of 11 percentage points in the past 6 years.
The following table displays the share of sales made by third-party sellers on Amazon.
| Year | Share of 3P Sellers’ Sales on Amazon |
|---|---|
| 2024(Q4) | 61% |
| 2023 | 60% |
| 2022 | 57% |
| 2021 | 55% |
| 2020 | 53% |
| 2019 | 53% |
| 2018 | 52% |
| 2017 | 50% |
| 2016 | 49% |
| 2015 | 45% |
Source: Statista
77% of Amazon sellers sell less than 10 products.
The majority of Amazon sellers sell just one product. Besides, 63% of Amazon sellers sell 5 or less than 5 products on Amazon.
Conversely, just 2% of Amazon sellers sell more than 1,000 products on Amazon. Further, 19% of the sellers sell 11 to 100 products on Amazon.
The following table displays the percentage of products sold by Amazon sellers.
| Number of Products | Percentage of Amazon sellers |
|---|---|
| 1 | 26% |
| 2 | 13% |
| 3 | 11% |
| 4 | 7% |
| 5 | 6% |
| 6 to 10 | 14% |
| 11 to 20 | 6% |
| 21 to 50 | 6% |
| 51 to 100 | 3% |
| 101 to 250 | 2% |
| 251 to 500 | 1% |
| 501 to 1,000 | 1% |
| More than 1,000 | 2% |
Source: Jungle Scout
96% of Amazon sellers sell products that are priced at $100 or less.
On the other hand, just 1% of Amazon sellers sell products that are priced over $100.
Besides, the majority of Amazon sellers sell products priced between $16 and $20, and 16% of Amazon sellers sell products priced between $11 and $15.
The following table displays the distribution of Amazon sellers by the price range of their products.
| Product Price Range | Percentage of Amazon Sellers |
|---|---|
| Under $5 | 4% |
| $6 to $10 | 9% |
| $11 to $15 | 16% |
| $16 to $20 | 18% |
| $21 to $25 | 16% |
| $26 to $30 | 15% |
| $31 to $50 | 13% |
| $51 to $100 | 5% |
| $101+ | 1% |
| Varying product prices | 3% |
Source: Jungle Scout
Amazon Seller Profits
28% of the sellers and small businesses are able to generate a profit margin of up to 10%.
Conversely, 13% of Amazon sellers stated that they have not generated any profit from their Amazon business.
Besides, 25% of the sellers, brands, and businesses stated that they were able to generate profits from Amazon sales in 2023.
The following table displays the distribution of Amazon sellers by the profit margins they have generated.
| Profit Margin | Percentage of Amazon Sellers and Small Businesses |
|---|---|
| Less than 1.5% | 12% |
| 6% to 10% | 16% |
| 11% to 15% | 13% |
| 16% to 20% | 15% |
| 21% to 25% | 15% |
| 26% to 50% | 13% |
| 51% to 100% | 1% |
| No profit | 13% |
Source: Jungle Scout
47% of Amazon sellers and small businesses stated that they generated a profit of $25,000 in their lifetime.
Conversely, just 1% of Amazon sellers made a profit of more than $5,000,000 in their lifetime.
Besides, 26% of Amazon sellers made a profit of between $25,000 to $500,000 in their lifetime.
The following table displays the lifetime profit generated by Amazon sellers.
| Profit Made By Amazon Sellers | Percentage of Amazon Sellers |
|---|---|
| Under $25,000 | 47% |
| $25,000 to $50,000 | 10% |
| $50,001 to $100,000 | 6% |
| $100,001 to $500,000 | 10% |
| $500,001 to $1,000,000 | 8% |
| $1,000,001 to $5,000,000 | 5% |
| More than $5,000,000 | 1% |
| I don’t know | 13% |
Source: Jungle Scout
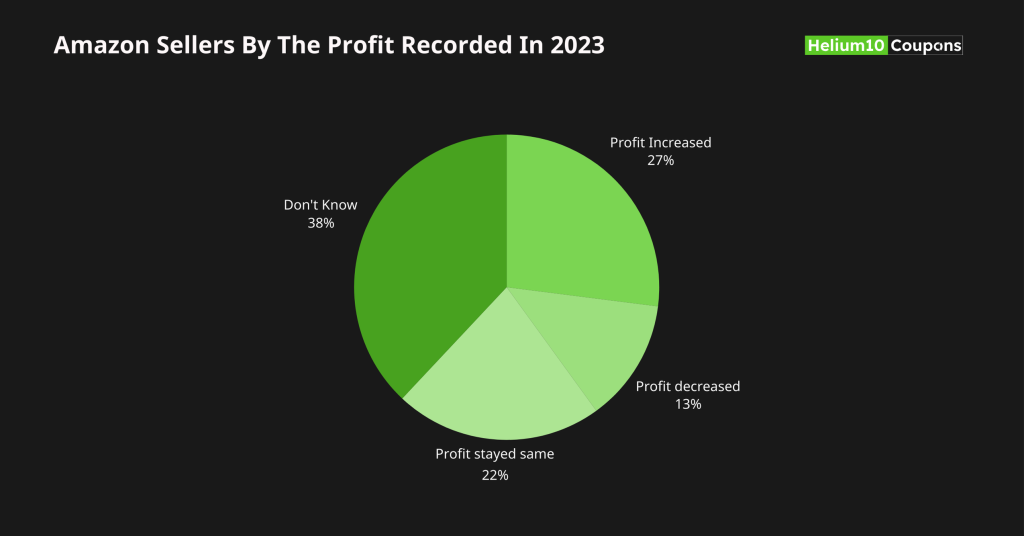
27% of Amazon sellers stated that their profit increased in 2023 compared to that of 2022.
On the other hand, 13% of Amazon sellers stated that their profit decreased in 2023. Meanwhile, the profit of 22% of the sellers stayed the same.
Here is a tale displaying the distribution of Amazon sellers by the profit recorded in 2023 compared to 2022.
| Profit Status | Percentage of Amazon Sellers |
|---|---|
| Profit Increased | 27% |
| Profit decreased | 13% |
| Profit stayed same | 22% |
| Don’t Know | 38% |
Source: Jungle Scout
Amazon Seller And Marketing Statistics
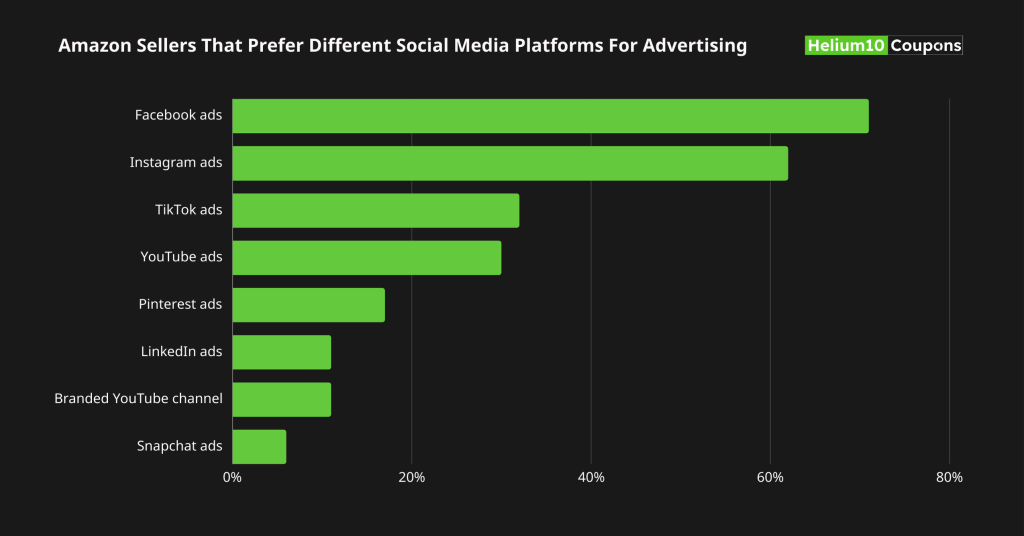
Over 7 in 10 Amazon sellers use Facebook ads for marketing.
Facebook ads are the most preferred social media advertising medium by sellers on Amazon.
At the same time, 62% of Amazon sellers prefer Instagram ads, and it is the second most preferred social media advertising method.
Other preferred social media marketing methods are TikTok ads, YouTube ads, and Pinterest ads.
The following table displays the percentage of Amazon sellers that prefer different social media platforms for advertising.
| Social Media Platform | Percentage of Sellers and Small Businesses |
|---|---|
| Facebook ads | 71% |
| Instagram ads | 62% |
| TikTok ads | 32% |
| YouTube ads | 30% |
| Pinterest ads | 17% |
| LinkedIn ads | 11% |
| Branded YouTube channel | 11% |
| Snapchat ads | 6% |
Source: Jungle Scout
68% of Amazon sellers and small businesses spend $2,500 or less on advertising on average per month.
Conversely, just 1% of Amazon sellers spend between $100,001 and 250,000 on advertising.
Further, 9% of Amazon sellers spend $2,501 to $5,000 on advertising, and 3% spend $10,001 to $25,000.
The following table displays the share of average monthly advertising spent on Amazon.
| Average Monthly Advertising Spend on Amazon | Sellers and SMBs |
|---|---|
| Less than $500 | 47% |
| $501 to 2,500 | 21% |
| $2,501 to $5,000 | 9% |
| $5,001 to $7,500 | 6% |
| $7,501 to $10,000 | 4% |
| $10,001 to $25,000 | 3% |
| $25,001 to $50,000 | 1% |
| $50,001 to $100,000 | 1% |
| $100,001 to 250,000 | 1% |
| Don’t know | 7% |
Source: Jungle Scout
Challenges Faced By Amazon Sellers
Trying new market tactics is one of the top business challenges faced by Amazon sellers.
Managing PPC advertising and optimizing product lists are other challenges Amazon sellers face.
Here are the top 10 business challenges faced by Amazon sellers and small businesses.
- Getting customer reviews
- Product research
- Trying new marketing tactics
- Optimizing product listing
- Increasing market share
- Managing PPC advertising
- Finding a supplier
- Managing finances
- Managing inventory
- Brading the business
Source: Jungle Scout
38% of Amazon sellers and brands state that increasing ad costs is one of Amazon’s top external challenges.
At the same time, 37% of Amazon brands and sellers state that shopping costs are one of the biggest challenges, while 29% consider inflation to be a challenge.
The following table displays the top external challenges faced by Amazon sellers and brands:
| External Challenges | Percentage of Amazon Sellers and Brands |
|---|---|
| Increasing ad costs | 38% |
| Increased shipping costs | 37% |
| Increased cost of goods | 35% |
| Rising storage fees | 32% |
| Inflation | 29% |
| Recession | 23% |
Other top external challenges that Amazon sellers face are:
- Increasing competition driving prices down
- Amazon changing search results to favor paid results over organic
- Changes in Amazon’s policies and terms of service
- Need of more capital to sell online effectively
- Keeping up with the relevant knowledge to sell online
Miscellaneous Amazon Seller Statistics
7 in 10 Amazon sellers and small businesses stated that financial management is their top focus in 2025.
Meanwhile, two-thirds of the sellers stated inventory management as their top focus in 2025.
Further, 69% of sellers and small businesses selling on Amazon stated that product research is their primary focus in 2025.
Here is a table displaying the top focus areas of Amazon sellers by business function.
| Top Focus Areas | Percentage of Amazon Sellers and Small Businesses |
|---|---|
| Financial Management | 70% |
| Inventory Management | 66% |
| Listing optimization | 65% |
| PPC management | 61% |
| Product Research | 69% |
Source: Jungle Scout
31% of Amazon sellers and brands manage their Amazon businesses for 4 to 10 hours each week.
On the other hand, 3% of the sellers and brands spend more than 60 hours managing their Amazon business.
Meanwhile, less than 1 in 5 sellers and brands spend fewer than 4 hours on their business.
Here is a table displaying further details about the share of sellers and businesses by the amount of time they spend on their Amazon business:
| Time Spent on Amazon Businesses | Percentage Of Sellers and Brands |
|---|---|
| 4 to 10 hours | 31% |
| Less than 10 hours | 19% |
| 21 to 30 hours | 12% |
| 11 to 20 hours | 21% |
| 31 to 40 hours | 7% |
| 41 to 50 hours | 4% |
| 51 to 60 hours | 4% |
| More than 60 hours | 3% |
Source: Jungle Scout
Over 1 in 2 Amazon sellers and small businesses have created a private label.
1 in 4 Amazon sellers make use of the wholesale model for their business. Another 1 in 4 sellers prefer to buy discounted products from the sellers and sell them on Amazon.
Meanwhile, nearly 1 in 5 Amazon sellers dropship.
The following table displays the business model used by Amazon sellers and small businesses to sell their products as of 2025.
| Amazon Businesses Model | Percentage of Amazon sellers |
|---|---|
| Private label | 54% |
| Wholesale | 25% |
| Retail Arbitrage | 25% |
| Online Arbitrage | 21% |
| Dropshipping | 19% |
| Handmade | 9% |
| Original products | 4% |
Source: Jungle Scout
82% of the sellers and small businesses on Amazon prefer fulfillment by Amazon.
The majority of Amazon sellers and small businesses prefer FBA methods to fulfill their orders. However, the share of sellers preferring FBA has declined by 3% compared to the previous year.
One-third of the businesses prefer fulfillment by the merchant to fulfill their orders. The share of sellers preferring FBM declined by 9% compared to the previous year.
On the other hand, 22% of merchants use both FBA and FBM to fulfill their orders.
Here is a table displaying the number of sellers using FBA, FBM, or both:
| Fulfillment Method Used | Total Share Of Sellers |
|---|---|
| Fulfillment by Amazon | 64% |
| Fulfillment by the merchant | 14% |
| Both | 22% |
Source: Jungle Scout
35% of Amazon sellers spent over $5,000 to start selling on Amazon.
Conversely, 2% of Amazon sellers stated that they did not spend a single dollar to start selling on the platform.
Besides, 23% of the Amazon sellers stated that they spent $1 to $1000 to start their business on Amazon.
The following table displays the distribution of Amazon sellers by the total amount they spent to start selling on Amazon.
| Average Money Spent | Percentage of Sellers |
|---|---|
| $0 | 2% |
| $1 to $500 | 14% |
| $501 to $1,000 | 9% |
| $1,001 to $2,500 | 16% |
| $2,501 to $5,000 | 23% |
| $5,001 to $10,000 | 18% |
| More than $10,000 | 17% |
| Don’t know | 2% |
Source: Jungle Scout
Over 4 in 5 Amazon sellers have used their own money to start selling on the platform.
At the same time, 23% of Amazon sellers have used credit cards to start selling on Amazon.
Conversely, 7% of the sellers borrowed money from their families to start selling.
Here is a table displaying the sources of money that Amazon sellers used to start their business on the platform.
| Source | Percentage of Amazon sellers |
|---|---|
| Own money | 81% |
| Credit card | 23% |
| Personal loan | 10% |
| Business loan | 7% |
| Family loan | 6% |
| Amazon lending | 4% |
| Small business administration or other government loan | 3% |
| Crowdfunding | 2% |
| Fintech lending | 1% |
Source: Jungle Scout
Related Posts:
Conclusion: 1.9 Million People Actively Sell On Amazon
According to the latest report by Seller App, there are 1.9 million active sellers on Amazon and a total of 9.7 million sellers. Of the total sellers, the majority of the sellers are aged between 25 to 44 years.
On the other hand, over half of the sellers are from the United States. Further, 1 in 7 Amazon sellers are able to generate an average monthly revenue of $5000 or less every month.
Overall, the number of Amazon sellers is likely to have crossed the benchmark of 10 million by the end of 2025, considering the latest reports are from 2022.
That was all about Amazon sellers from my side. Here are some related reads you can check out: